
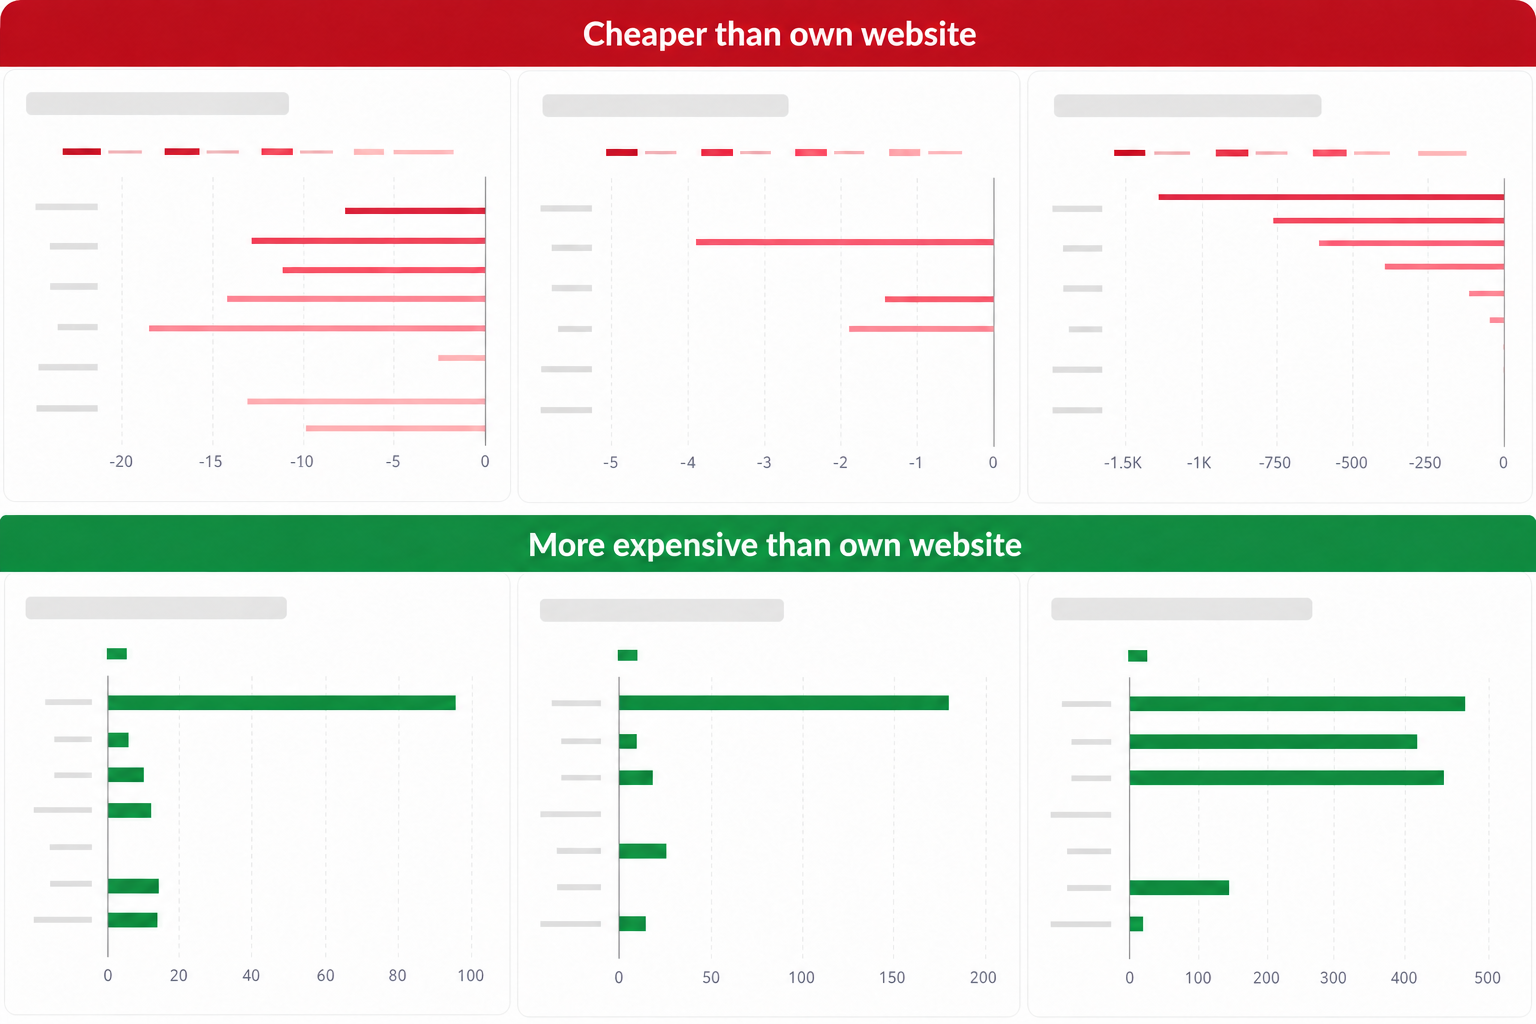
The energy market can shift considerably in just a few days. One supplier increases its welcome bonus, another changes its feed-in compensation and a third introduces a new contract. Consumers see these changes immediately on comparison sites. For energy suppliers themselves, keeping track of the entire competitive landscape is much more difficult.
Consumers also look beyond the electricity rate. What ultimately matters is the expected total at the bottom of the comparison. A supplier may offer a competitive price per kWh and still rank lower because of fixed charges, feed-in charges or a less attractive bonus. Automated price monitoring collects rates, terms, discounts and positions every day, making it clear why an offer rises or falls.
Why comparing energy prices is complicated
Comparing an electricity rate involves more than an electricity price and a gas rate. The expected annual amount depends on fixed delivery charges, contract duration, welcome discounts, feed-in compensation and any charges for feeding electricity back into the grid. Household energy consumption and the amount of self-generated electricity also affect the outcome.
A contract with a relatively low delivery rate may still be more expensive because of high fixed charges. Conversely, a supplier with a higher rate may temporarily rank first because of a substantial welcome bonus. A single price therefore says very little. Only when every component is calculated for the same consumption profile does the comparison become useful for a pricing team.
- Electricity rate per kWh and gas rate per m³
- Fixed delivery charges and contract duration
- Welcome discounts and bonuses
- Feed-in charges and compensation
- Fixed, variable or dynamic contract
- Consumption, postcode and amount of electricity fed back into the grid
Monitor the position of energy contracts every day
One practical application is monitoring your own energy contracts against those of other suppliers every day. First, you determine which contracts, suppliers, comparison sites and customer profiles matter. The offers are then collected and calculated consistently using the same definitions.
For every offer, the dataset can include the contract type, duration, electricity and gas rates, fixed charges, discounts, feed-in terms and the calculated annual or monthly amount. Its position on a comparison site can also be recorded. The result is not a one-off snapshot, but a dataset that grows every day.
This reveals when an offer changes position, how long a competitor keeps a promotion active and which component is likely to be responsible for a new ranking. That is more useful than a table containing only current rates. The market becomes meaningful when changes are tracked consistently over time.
A contract drops from position 3 to position 8
Suppose an energy supplier offers a one-year fixed contract for households with solar panels. On Monday, the offer is still in third place on an important comparison site. A few days later, it has dropped to eighth place.
Without monitoring, the commercial team can see that something has changed, but not what caused it. The manual work then begins: opening comparison sites, entering multiple postcodes, reviewing contract details and recording changes in spreadsheets. By the time the picture is complete, the market may have changed again.
With daily price monitoring, the comparison is already available. It may show, for example, that competitors have not lowered their basic electricity rate at all. Instead, they increased their welcome bonus or temporarily changed their feed-in charges.
That distinction prevents the wrong response. If the team looks only at the kWh price, lowering the rate may seem logical. But that would sacrifice margin while the actual difference lies elsewhere. A targeted change to the bonus or contract terms may be enough to return to the top results.
Compare by customer and consumption profile
There is no universally attractive energy contract. An offer that works well for a low-consumption apartment may be far less favourable for a family with a heat pump, solar panels and an electric car. A supplier’s position can change considerably when consumption, postcode or the amount of electricity fed back into the grid changes.
Calculating offers for multiple profiles creates a more nuanced picture. A contract may rank seventh for an average household while placing in the top three for smaller households. This is useful not only for pricing. It also gives marketing a clearer view of the customer groups a campaign could target.
The reverse also applies. When a supplier consistently ranks poorly for one important profile, it is immediately clear where further investigation is needed. The entire product may not need to change; the difference may be caused by a single rate component or condition.
- Small household with low consumption
- Average household
- Large household with high consumption
- Household with solar panels
- Household feeding a large amount of electricity back into the grid
- Fully electric household with a heat pump or electric car
Historical data provides context
The current position is most valuable when viewed alongside what came before it. Recording prices and terms in the same way every day eventually reveals patterns that remain hidden on an individual comparison page.
You can see how often competitors change their offers, when bonuses are usually increased and how long temporary promotions remain active. The data also shows which suppliers consistently rank highly and how quickly providers respond to each other’s changes.
A remarkably cheap competitor offer does not necessarily represent a new market standard. It may be a short campaign that disappears after a week. Without history, that distinction is difficult to make. A longer time series changes the discussion from “What is happening today?” to “Is this a temporary promotion or a structural market movement?”
Automatic alerts for relevant changes
Not every adjustment requires immediate attention. A small difference for one profile may be insignificant, while dropping out of the top three for a widely used profile may have commercial consequences. Alerts can therefore be linked to changes that genuinely matter.
The team can receive a notification when its own offer drops out of the top three, a competitor sharply reduces its annual rate, a new supplier appears or feed-in terms change. Nobody has to watch dashboards continuously.
This does not mean that every alert must automatically lead to a price change. Sometimes consciously doing nothing is the best decision. The difference is that the decision is based on current market information rather than an assumption.
One dataset for pricing, marketing and management
Price monitoring may initially sound like a tool for the pricing team. In practice, the same dataset can support several departments within an energy supplier. Pricing assesses rates, margins and terms. Marketing sees which bonuses and messages competitors use in the market. Sales gains a clearer picture of the customer groups for which the company’s offer is attractive.
Product teams benefit as well. New contract types, loyalty benefits and additional services often first appear across a mixture of supplier websites and comparison platforms. Monitoring that information systematically makes market developments visible sooner. Each department asks different questions, but the source remains the same: a current, consistently structured collection of market data.
Not automatically the cheapest, but deliberately competitive
Price monitoring does not mean that an energy supplier must always become the cheapest. That would be a limited and often expensive strategy. A supplier may deliberately aim for a top-five position, offer better terms or focus on a target group that is less driven by the lowest price.
The data shows what such a choice means in practice. How large is the difference from the cheapest supplier? For which consumption profiles does the contract remain competitive? And does that picture change when a competitor’s welcome bonus expires?
For an energy supplier, the value of price monitoring therefore goes beyond collecting energy rates. Its real purpose is to track and explain the company’s market position every day. Pricing, marketing and sales work from the same market view and can respond faster without lowering rates unnecessarily.